VS HTTP files break OpenTelemetry tracing
As I was preparing a sample ASP.NET Core Web API project to test the Grafana OpenTelemetry Docker image with, tracing for some reason didn't work for me. It took me a while to realize that the problem wasn't in the sample project or the Grafana container. The .http files in Visual Studio were at fault.
After I had configured a sample project to emit OpenTelemetry data and the Grafana Docker image to collect and view that data, only metrics and log entries showed up, but there were no traces.
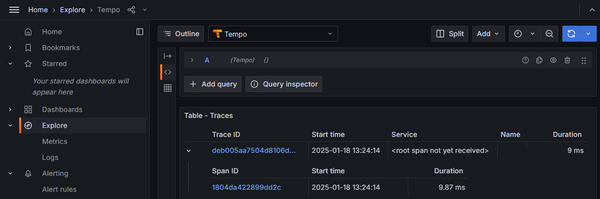
The default parentbased_always_on sampler should always emit traces in non-distributed scenarios, at least according to documentation. As I was running out of ideas, I tried setting OTEL_TRACES_SAMPLER to always_on. It helped. The traces now showed up in Grafana. But this meant that the requests I was making were treated as distributed. And the data in Grafana confirmed that (it complained about not receiving the root span from the parent service):
I intercepted the headers of the Visual Studio request from the .http file using the debugger, and this confirmed my suspicion. The request contained the following header:
traceparent: 00-b31f443e75921a0f87894cd211950514-3cfab265eedf6ce1-00
Since I'm not familiar with the exact format of headers for distributing tracing, I had to look up the meaning of the traceparent header value in the specification. I learned that the final 00 part of the value indicates that caller did not record the trace.
This explains why the service did not emit any tracing data when the default parentbased_always_on sampler was used. This setting specifies that when the parent is present, tracing data is only emitted if the parent did it as well. Since the traceparent header value states that the parent didn't emit tracing data, the service doesn't either.
I don't know why Visual Studio includes such a header in the request, and I can't think of a good reason for it. I also couldn't find any documentation about it, or a way to turn it off. I guess I'll just have to remember not to use .http files in Visual Studio when I need tracing data.
Out of curiosity, I tried invoking the request from the same .http file in JetBrains Rider and in Visual Studio Code using the REST Client extension. Neither of them included a traceparent header in their request which makes it even more surprising why Visual Studio does it.
If you want to try out the described behavior yourself, you can use the sample project from my GitHub repository. It contains an ASP.NET Core Web API project configured to emit OpenTelemetry data and a docker-compose.yml file with a Grafana Docker image for collecting and viewing OpenTelemetry data.
It would be great if there was a way to turn off the traceparent header in the requests from Visual Studio. But even knowing about it helps: I can invoke the endpoints in some other way when I need to see the resulting trace data. For example, by opening the same .http file in Visual Studio Code and invoking the request from there.
