OpenTelemetry collection during development
OpenTelemetry is a standard for collecting all types of observability data: logging, tracing and metrics. There is an increasing number of tools that can collect OpenTelemetry data emitted from applications, but not all of them are easy and convenient to set up locally for use during development.
Last year, a Grafana-based Docker image has been released with a collector and viewer fully preconfigured for all observability data. The image is accompanied by scripts and instructions for running the image. I prefer using docker-compose.yml and although there is no such file in the repository, it's easy enough to prepare:
version: "3"

services:
  otel-lgtm:
    image: grafana/otel-lgtm
    container_name: otel-lgtm
    ports:
      - 3000:3000
      - 4317:4317
      - 4318:4318
Once the container starts, you can access the Grafana web user interface at http://localhost:3000. But to see any data, you need an application emitting it. I decided to create a minimal ASP.NET Core Web API service for that. I used the following NuGet packages for that:
- OpenTelemetry.Instrumentation.AspNetCore to add OpenTelemetry instrumentation to the project,
- OpenTelemetry.Exporter.OpenTelemetryProtocol to export the data to the OpenTelemetry Collector,
- OpenTelemetry.Extensions.Hosting to simplify the setup code.
The configuration is well documented, but essentially, you only need a few lines of code:
var otel = builder.Services.AddOpenTelemetry();
otel.ConfigureResource(resource =>
    resource.AddService(builder.Environment.ApplicationName));
otel.WithMetrics(metrics =>
    metrics.AddAspNetCoreInstrumentation());
otel.WithTracing(tracing =>
    tracing.AddAspNetCoreInstrumentation());
otel.UseOtlpExporter();
The default settings already work with the before mentioned Grafana Docker images, so there isn't any further configuration necessary. You're ready to run the service and invoke its only endpoint to emit some OpenTelemetry data. Just make sure you're not using an .http file in Visual Studio or you won't get any tracing data.
You can find each type of collected data in a different part of Grafana:
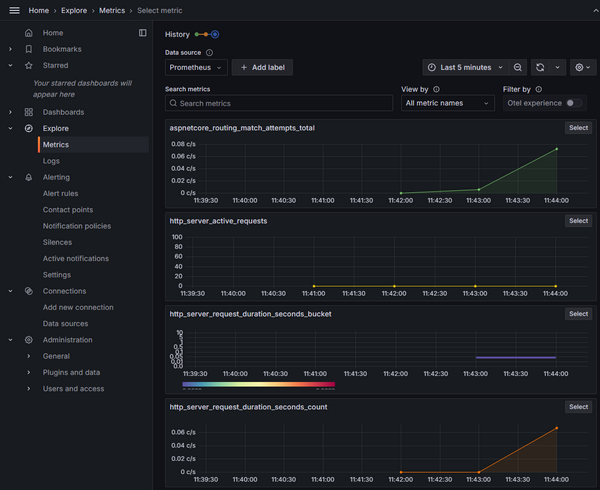
Click on Metrics in the sidebar and then on the New metric exploration button to get access to the metrics:

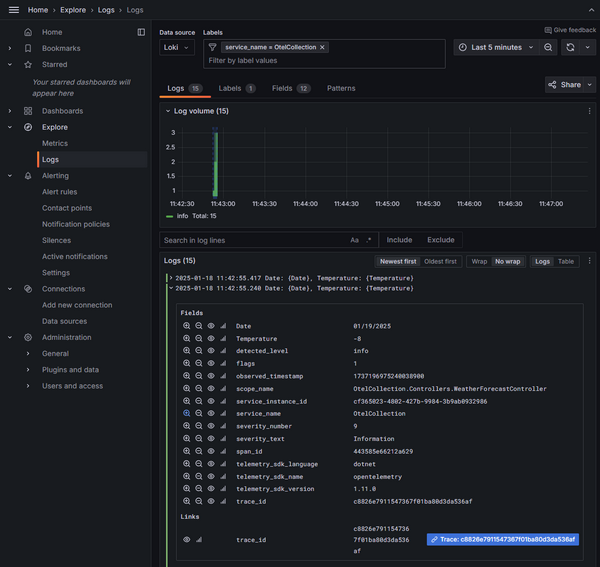
Click on Logs in the sidebar and then on the Show logs button to view the log entries:

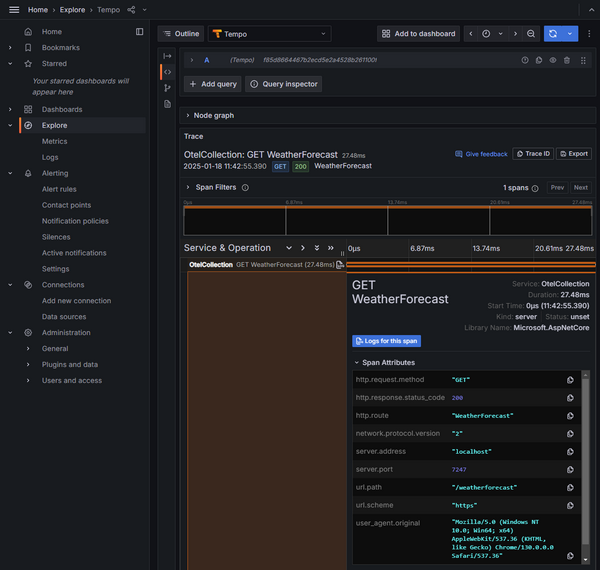
Click on Explore in the sidebar, select Tempo as data source from the dropdown, and click on the Search query type to view the traces. Or alternatively, click on the Trace link in a log entry:

You can find a sample project with OpenTelemetry set up as described in my GitHub repository. There's also a docker-compose.yml file in the repository root for you to use, so you can easily try out the Grafana container and browse some data inside it.
Although, the .NET documentation for using OpenTelemetry includes several examples for setting it up with different observability tools, none of them are as simple as this one. I'm glad I learned about Grafana OpenTelemetry Docker image, and I'm convinced I'll be using it regularly when developing applications with OpenTelemetry observability implemented.
