Logging from .NET to Elasticsearch
Although you might have not heard often of Elasticsearch being used for collecting logs from a .NET application, the scenario is well-supported. The setup is simple and it works good.
There is an official logging provider available with well written documentation. Below are the key setup steps:
- Install the Elastic.Extensions.Logging NuGet package.
- Register the logging provider:
builder.Logging.AddElasticsearch(); - Configure it in the
appsettings.jsonfile by overriding (very reasonable) default values in theLogging.Elasticsearchsection. Below, I'm excluding user information from the logs, adding a tag to indicate the environment and setting the Elasticsearch URL:{ "Logging": { "Elasticsearch": { "IncludeUser": false, "Tags": ["Development"], "ShipTo": { "NodeUris": ["http://localhost:9200"] } } } }
That's all you need to do in your .NET project. If you want to try it out locally, you can set up an Elasticsearch instance with a Kibana frontend in Docker with the following docker-compose.yml file:
version: "3"

services:
  elasticsearch:
    image: docker.elastic.co/elasticsearch/elasticsearch:8.16.1
    container_name: elasticsearch
    environment:
      - discovery.type=single-node
      - ES_JAVA_OPTS=-Xms1g -Xmx1g
      - xpack.security.enabled=false
    ports:
      - 9200:9200
    networks:
      - elk
  kibana:
    image: docker.elastic.co/kibana/kibana:8.16.1
    container_name: kibana
    environment:
      - ELASTICSEARCH_HOSTS=http://elasticsearch:9200
    ports:
      - 5601:5601
    networks:
      - elk
    depends_on:
      - elasticsearch

networks:
  elk:
    driver: bridge
After you start the containers with docker compose up -d, you can open Kibana in your browser at the following URL: http://localhost:5601.
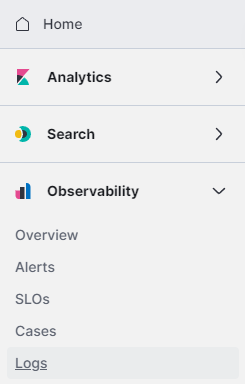
Run your .NET application to emit some log messages, then navigate to Observability > Logs > Logs Explorer:

You should be able to see the log entries in the list:

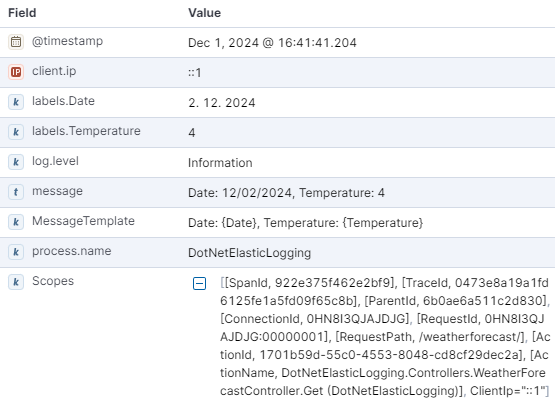
If you take a closer look at the details of an entry, you can notice the following:
- All the basic information about the origin of the log entry is available automatically: process, timestamp, logging level…
- The environment the log entry originates from can be determined from
tagsas configured inappsettings.json. - Structured logging is fully supported: in addition to the composed
messageyou can see themessageTemplateused as well as the individuallabels.*fields. - All values from logging scopes are listed and also parsed as individual fields, e.g., the
client.ipbelow.

Of course, all of these values can be shown as columns in the list or included in filters.
You can find a sample project in my GitHub repository. It consists of an ASP.NET Core Web API project with preconfigured logging to Elasticsearch, as well as a docker-compose.yml file for running Elasticsearch and Kibana in your local Docker instance. It should be enough for you to get it running locally and try it out.
ELK Stack is a popular set of tools for self-hosted log analysis. It works great with .NET and is easy to set up locally, which can make it a great choice for collecting logs during development or for your hobby project running in your home lab.
